Finally here: Our Second Industrial Data Platform Capability Map
Find our second release of our DataOps Capability Map, explainers, some more insights on where UNS fits in, extra resources and our new vendor list here!
In November of last year we published our first Industrial Data Platform Capability Map and we promised to equip you with an updated one ‘soon’. Honestly, that took us a while, but for all the good reasons. After we published our map, our mailbox exploded, we created our DataOps podcast and recently launched our ITOT.Academy. We also started working on our Industrial AI series which we will launch in the coming weeks and will run for the rest of the year.
Lots of fun things, but now back to business!
In this extra long article you’ll find:
V2 of The Map,
The Core Capabilities & Supporting Functions Explained,
Where the UNS (Unified Namespace) fits in,
And… our updated Industrial DataOps Vendor list.
And please:
Use it,
Like it,
Spread the word !
The Industrial Data Platform (revisited)
The only way to truly scale industrial data solutions is to break free from the cycle of rebuilding custom data pipelines again and again — the spaghetti model that eats time, budget, and momentum. It’s not that the ideal state is particularly complex; in fact, the concept is straightforward. But in many industrial environments, we’re still far from achieving it.
In the first version of the map, we focussed mainly on the ingestion and contextualization of data. In this one, we keep all those basic concepts, but we have put more emphasis on the data consumption part, as well as some more advanced capabilities.

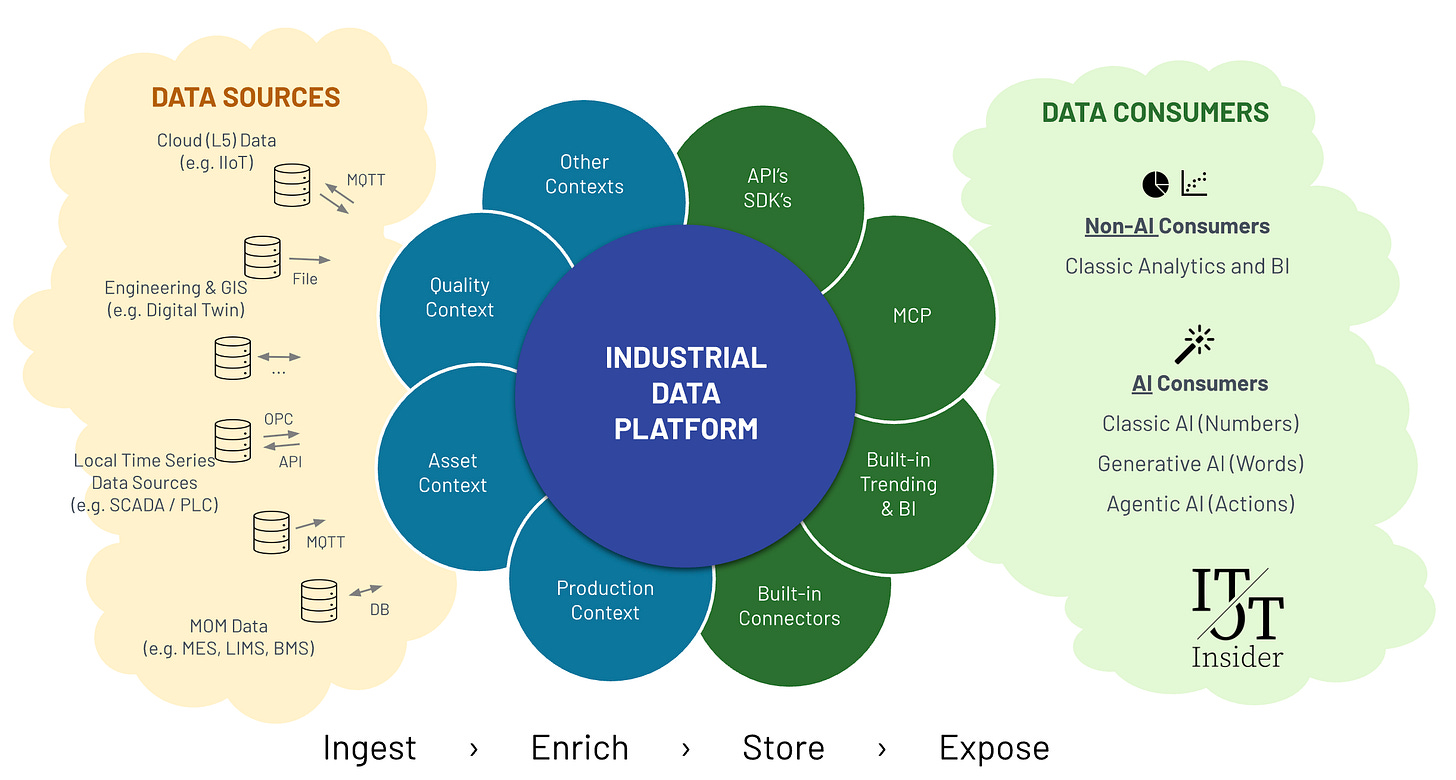
The model we need starts with a central data platform (that’s the blue circle in the middle of the picture below). This platform should ingest data with context — not just raw numbers — from a diverse range of systems and sources (yellow cloud on the left), including historians, SCADA systems, ERP, MES, and more. Crucially, it must handle the complexity of those sources once, not every time a new use case comes along.
On the other side, we want all types of data consumers (from engineers and business users to analytics tools and AI agents) to be able to access this data in a uniform, scalable, and trustworthy way (green cloud on the right). That means they don’t need to hunt for tags, reverse-engineer spreadsheets, or request a custom integration for every new project. They simply consume what’s already clean, structured, and available. In our upcoming series on Industrial AI, we will go into much more detail. We’ll explain all the terms and buzzwords of today (think Agentic AI, Generative AI and MCP) and we’ll talk to industry experts similar to what we did in our DataOps series. (So, do you need another reason to subscribe? 😀)
This is the shift: from patchwork projects to platform thinking, from one-off wins to repeatable scale (learn more about why scaling matters, in this previous podcast).
The Industrial Data Platform Capability Map V2
As with any capability map, this one won’t cover everything, and that’s perfectly fine. It’s here to start the right conversation. You can also use it as a base for preparing your request for information (RFI) or request for proposal (RFP). You also want to look for interoperability, open protocols, good documentation, proven track records, and standardized implementations as much as possible (which results in interchangeable components instead of vendor lock-ins).
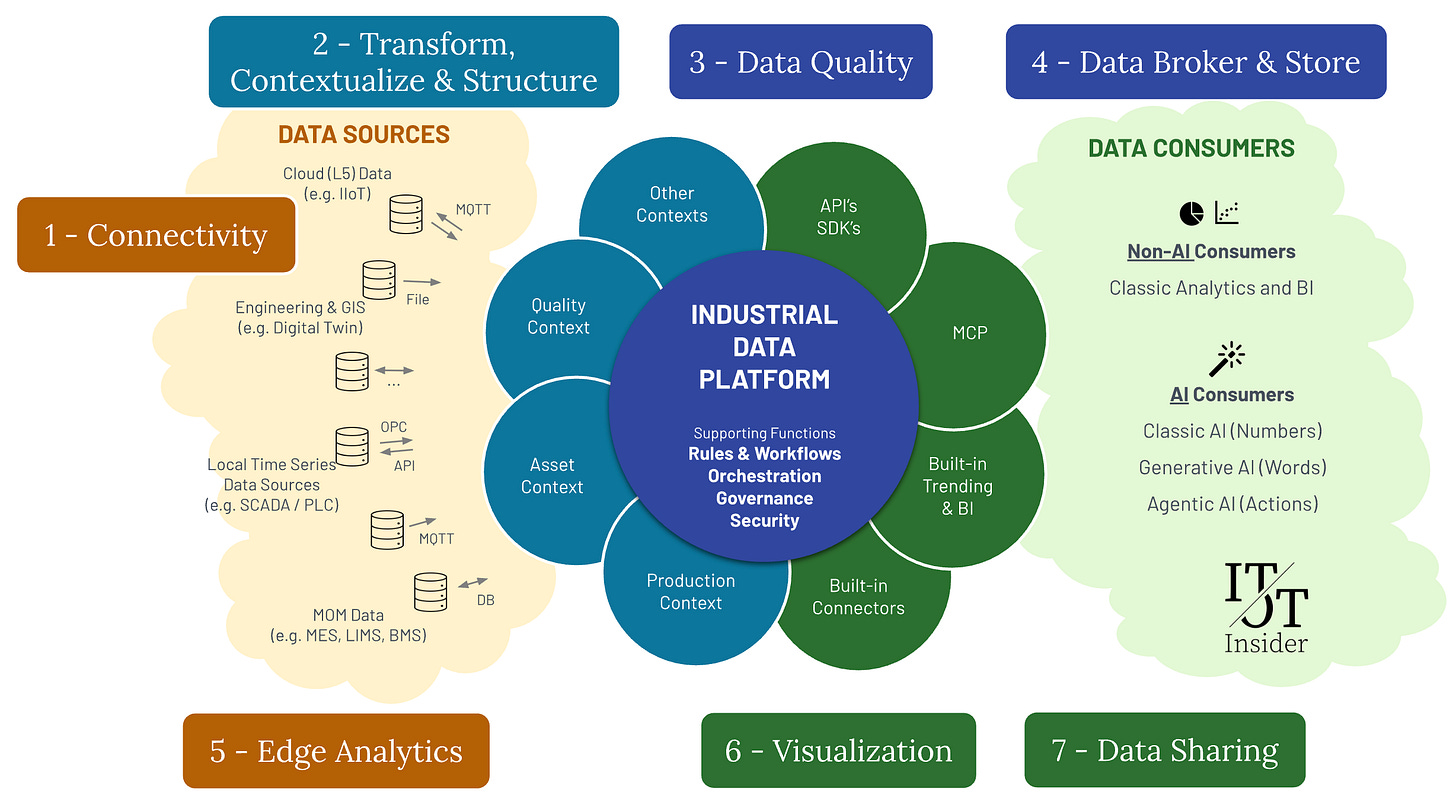
In the next diagram all capabilities are mapped. Below this diagram, you’ll find an explanation of all seven. In the next chapters, you’ll also find more info on the supporting functions, a mapping of UNS and additional learning resources.

1 – Connectivity
Every data platform begins with the same essential requirement: getting the data in. In an industrial environment, this is rarely straightforward. Manufacturing plants are often home to a mix of old and new technologies. You might find a brand-new production line equipped with modern IIoT sensors streaming real-time data over MQTT, sitting right next to a 30-year-old PLC still running on a legacy protocol like Modbus RTU. That’s why the first capability of your data platform must be a secure, scalable, and adaptable connectivity layer. One that speaks the many languages of industrial systems, both old and new. Some systems require high-throughput (for example sensors spotting defects in products which might pass by at a rate of 10’s to 100’s a second), for others redundancy is non-negotiable, and in many industrial sites, especially remote ones, the ability to buffer and backfill data during connectivity loss is crucial. Real-time streaming might be critical in one use case, while another might rely entirely on polling. The platform must accommodate all of this, seamlessly.
(We talked about Connectivity a couple of times in our podcast, we’d like to point you to our discussion with Litmus and HiveMQ as a starting point to learn more!)
2 – Transform, Contextualize & Structure
Connectivity gives you access to raw data, but raw data alone is not enough. For it to be useful, you need to understand what it means. This is where the second capability comes in: transforming and enriching the data with context. This is where unstructured values are linked to real-world meaning. To achieve all this, the platform must support the ingestion and management of metadata, versioning of asset models, flexible schema handling, and rich ontology support. This is where the heavy lifting of Extract-Transform-Load (ETL) pipelines comes into play, helping merge and structure information from various systems into a usable format.
The capability map doesn’t tell you where the contextualization happens — only that it matters. Sometimes, equipment arrives with a ready-made contextual model baked into the payload. You might take it as-is, or more often, you’ll reshape it to fit your own structures. But in many cases, you’ll be staring at a metadata desert: what looks like an oasis at first quickly turns out to be a mirage.
(More about Context in this previous article)
3 – Data Quality
Even with perfect connectivity and context, bad data will sink your insights. That’s why the third capability is focused on monitoring and managing data quality. Sensor data is notoriously messy. Outliers, flatlines, NULL-values, connectivity problems, calibration drift, and missing metadata are all common issues—and they’re often invisible until you’re deep into your analysis.
Data quality should be tracked, scored, and exposed as part of the platform itself, not hidden in spreadsheets or addressed on an ad hoc basis. Some platforms simply flag errors; others go a step further by cleaning and correcting the data, applying intelligent smoothing or interpolations, or even incorporating user feedback to validate anomalies.
Depending on your use case, your requirements might range from simple threshold checks to advanced statistical monitoring. Either way, it’s important to decide how this information will be made available: will you expose it in dashboards, integrate it into reports, or use it to feed quality KPIs? And who owns the process of fixing bad data? That’s a crucial question for sustainability.
(More about Data Quality in this previous article)
4 – Data Broker & Store
The fourth capability is about keeping your data (and keeping it accessible). This includes raw data, structured context, cleaned datasets, and even derived insights. At its core, your platform must be able to act as a high-performance, time-series database, built to store and retrieve large volumes of sensor data efficiently.
But that’s just the beginning. Most modern platforms also need to support event and alarm storage, allow for publish-subscribe models using protocols like MQTT, and offer strong data lifecycle management features.
Layered storage following the Bronze-Silver-Gold pattern helps manage this complexity: raw data lands in Bronze, cleaned and validated data lives in Silver, and fully prepared, report-ready datasets are found in Gold. These principles are commonly used in Delta Lake architectures and can help structure your data for the long haul.
(More about time series data storage in our podcast with InfluxData)
5 – (Edge) Analytics
Sometimes, data is most valuable when processed as close to the source as possible. That’s where the fifth capability comes in: analytics at the edge and on the platform. Edge analytics can be as simple as computing statistical summaries before data is sent upstream, or as advanced as running ML models to analyze video feeds or vibration signals in real time (and now more and more LLM applications as well).
On the platform itself, users may want to define virtual tags (calculated values that don’t exist in the source systems but are derived from existing data). Or run batch analytics jobs to find patterns in historical datasets. This capability enables anomaly detection, predictive maintenance, and more advanced operational use cases to become reality.
Preprocessing at the edge also helps reduce the load on your central systems and minimizes network traffic, especially in high-frequency or bandwidth-constrained environments.
(More about edge analytics in our podcasts with Litmus, Crosser and HighByte)
6 – Visualization
If a tree falls in the forest and no one hears it, did it make a sound?
The same can be said for data. If it’s not presented in a meaningful way, does it matter? The sixth capability is all about visualization—translating the technical depth of the platform into intuitive, accessible insights for everyone in your organization.
Most users will never touch the connectivity or the data model, but they will use dashboards and reports. Whether they’re process engineers monitoring KPIs, energy managers looking for anomalies, or operators reviewing last week’s performance, their experience needs to be seamless.
The platform should support rich, interactive visualizations, easy dashboard sharing, and collaborative tools that encourage discussion and discovery. These tools can either be native/built-in into the platform or be third party tools which sit on the data consumer side and utilize the platform’s data sharing capabilities to get the data in context they need.
7 – Data Sharing
No platform exists in a vacuum. The seventh capability is about opening up. Whether it's exposing (REST) APIs to be used by data science tools, sending curated datasets to the corporate data warehouse, or enabling partners to connect digital twins to your production systems, sharing data is critical to scale.
All of this means robust interfaces, support for multiple formats and protocols, and clear governance around what data can be accessed. Just as important is the flexibility to expose data in different forms: raw, cleaned, contextualized, or aggregated. The more adaptable your sharing layer, the more future-proof your platform becomes.
More recently, this is also where the Model Context Protocol (MCP) comes into play. In simple terms, MCP is a standardized way for AI models to talk to other systems — securely, consistently, and with full awareness of context. In an industrial setting, this means an AI agent could (in theory!) query your maintenance history, pull real-time sensor data, or update a work order in your CMMS. But in practice, MCP requires a stable and secure set of APIs it can query (so your software needs to support that), it also needs the contextual layer in order to understand the physical reality and finally, there are a lot of governance and security considerations to take into account as well. Remember that all of this MCP and LLM stuff is fairly new and very experimental. So experiment, but be sure to also implement guardrails when putting these things into production. We’ll do a further deep dive into MCP in a future article.
The Supporting Functions Explained: Orchestration, Governance, Security
While the 7 capabilities we just explored form the core of any Industrial Data Platform, there’s more to a successful system than the shiny technical building blocks. To deliver value over the long haul, your platform must be deployable, operable, and maintainable across all the environments where it’s needed — from factory floors to corporate data centers to the cloud. This is where the supporting functions come in. They’re not always visible to the end user, but they are the reason your platform won’t turn into an untouchable spaghetti monster after year one.
Rules & Workflows
In this new version, we’ve added “Rules & Workflows” — and that also covers running data pipelines — for good reason. A mature data platform doesn’t just store and share information; at some point, it needs to act on it. Rules are the guardrails and triggers: from alerting when a sensor crosses a threshold, to flagging when a data quality check fails. Workflows, on the other hand, capture the business logic that turns raw events into meaningful actions — whether that’s automatically routing a maintenance request, enriching incoming data before storage, or kicking off a compliance check.
In practice, this means your platform should support configurable, reusable rules and workflows that can be adapted by those who understand the process, not just the developers. Done right, they make your data environment more responsive, automated, and aligned with real-world operations — which is the difference between a passive data store and an active decision engine.
Orchestration
Orchestration is how you manage the entire environment: deploying, updating, scaling, and retiring components without losing your sanity. Historically, OT teams deployed systems by manually installing Windows servers, clicking through setup wizards, and documenting every step in a Word file. Those days should be over.
Modern orchestration borrows from IT: automation, version control, containerization, and lifecycle management that make deployment faster, safer, and more predictable. Whether you’re running fully on-prem, in the cloud, or in a hybrid model, orchestration is what ensures new connectors, dashboards, or analytics models can be rolled out without breaking existing operations. It’s the backbone of repeatability and resilience.
But that’s not all! Monitoring and Observability are important too, making sure the system runs when it has to run. The more critical use-cases the more critical this becomes.
Governance
Governance is not as flashy as AI analytics or digital twins, but without it, your data platform will eventually fail. At its core, governance is about clarity and control: data management, user management, internal standards, ownership, and processes. In industrial contexts, data management is especially critical.
It’s not enough to have naming conventions written on a wiki somewhere — you need both processes and a technical mechanism to manage master data. Otherwise, you’re back to version 73 of “final_asset_list.xlsx” circulating over email. Good governance turns chaos into trust: you know where the data comes from, how it’s structured, and who’s responsible for keeping it clean.
Security
Cybersecurity in industrial environments is non-negotiable. The risks are too high — especially when control systems are involved. We follow a layered approach inspired by the Purdue Model: ideally, systems close to the control layer only publish data upwards, and any incoming data is strictly validated through guardrails before being accepted. For example, if an optimizer proposes a new setpoint, the platform should verify it before applying it to a live process.
That also means implementing secure communication (TLS), role-based access control, auditing, and compliance with standards like IEC 62443. It means regular patching and updates (still a weak point in many OT environments) and it means thinking about security as something embedded in the design, not bolted on after a breach.
Where is my UNS (Unified Namespace) in this capability map?
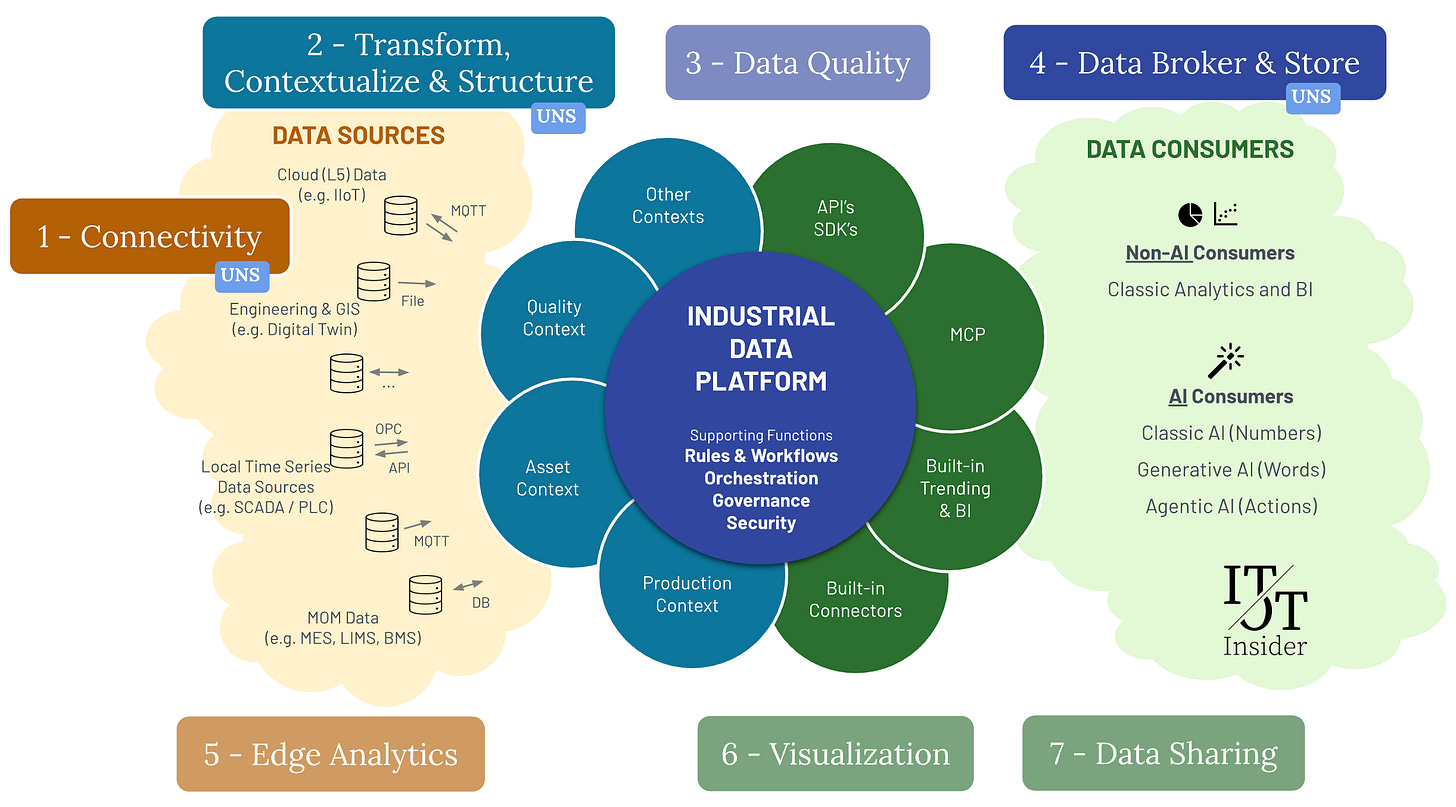
The Unified Namespace (UNS) is one of those terms that gets thrown around a lot, often without much explanation. Some treat it like it’s a product you can buy, others like it’s magic glue that connects your OT and IT systems. But here’s what it really is: a design pattern. One focused on making OT data usable across the enterprise—quickly and consistently.
(We’ve written our first article on UNS a year ago, you can find it here although the content is slightly outdated)
At its core, the UNS is about:
Uniform connectivity (Capability 1): often using MQTT or OPC-UA to collect data from across your plant.
Structured modeling (Capability 2): typically based on ISA-95 or similar, so tags and assets don’t live in chaos.
Central availability (Capability 4): a broker or data hub that acts as a single, real-time source of truth for OT data.
You could think of the UNS as a subset of our full capability map.
It’s a pattern, not a product, and it doesn’t try to solve every problem. But it’s a great entry point. It makes the simple things easier—getting data from the line into the cloud, feeding it into dashboards, or connecting to a digital twin. It’s especially useful when you’re just getting started and need something quick, clean, and easy to explain.
Learning resources
1️⃣ David was a guest on the Industry40.tv podcast where he explained the first version of the capability map, although there are some changes, the basics remain the same:
2️⃣ Be sure to review the previous parts for essential background information if you are new to our blog: Part 1 (The IT and OT view on Data), Part 2 (Introducing the Operational Data Platform), Part 3 (The need for Better Data), Part 4 (Breaking the OT Data Barrier: It's the Platform) and Part 5 (The Unified Namespace).
3️⃣ And if you want to take an instructor-led course, there is the ITOT.Academy, where we focus on concepts, not tools and on frameworks, not features. The cohorts starting this week are already fully booked, but next dates are already available and we also offer private (& tailored) cohorts!
Industrial DataOps Vendors
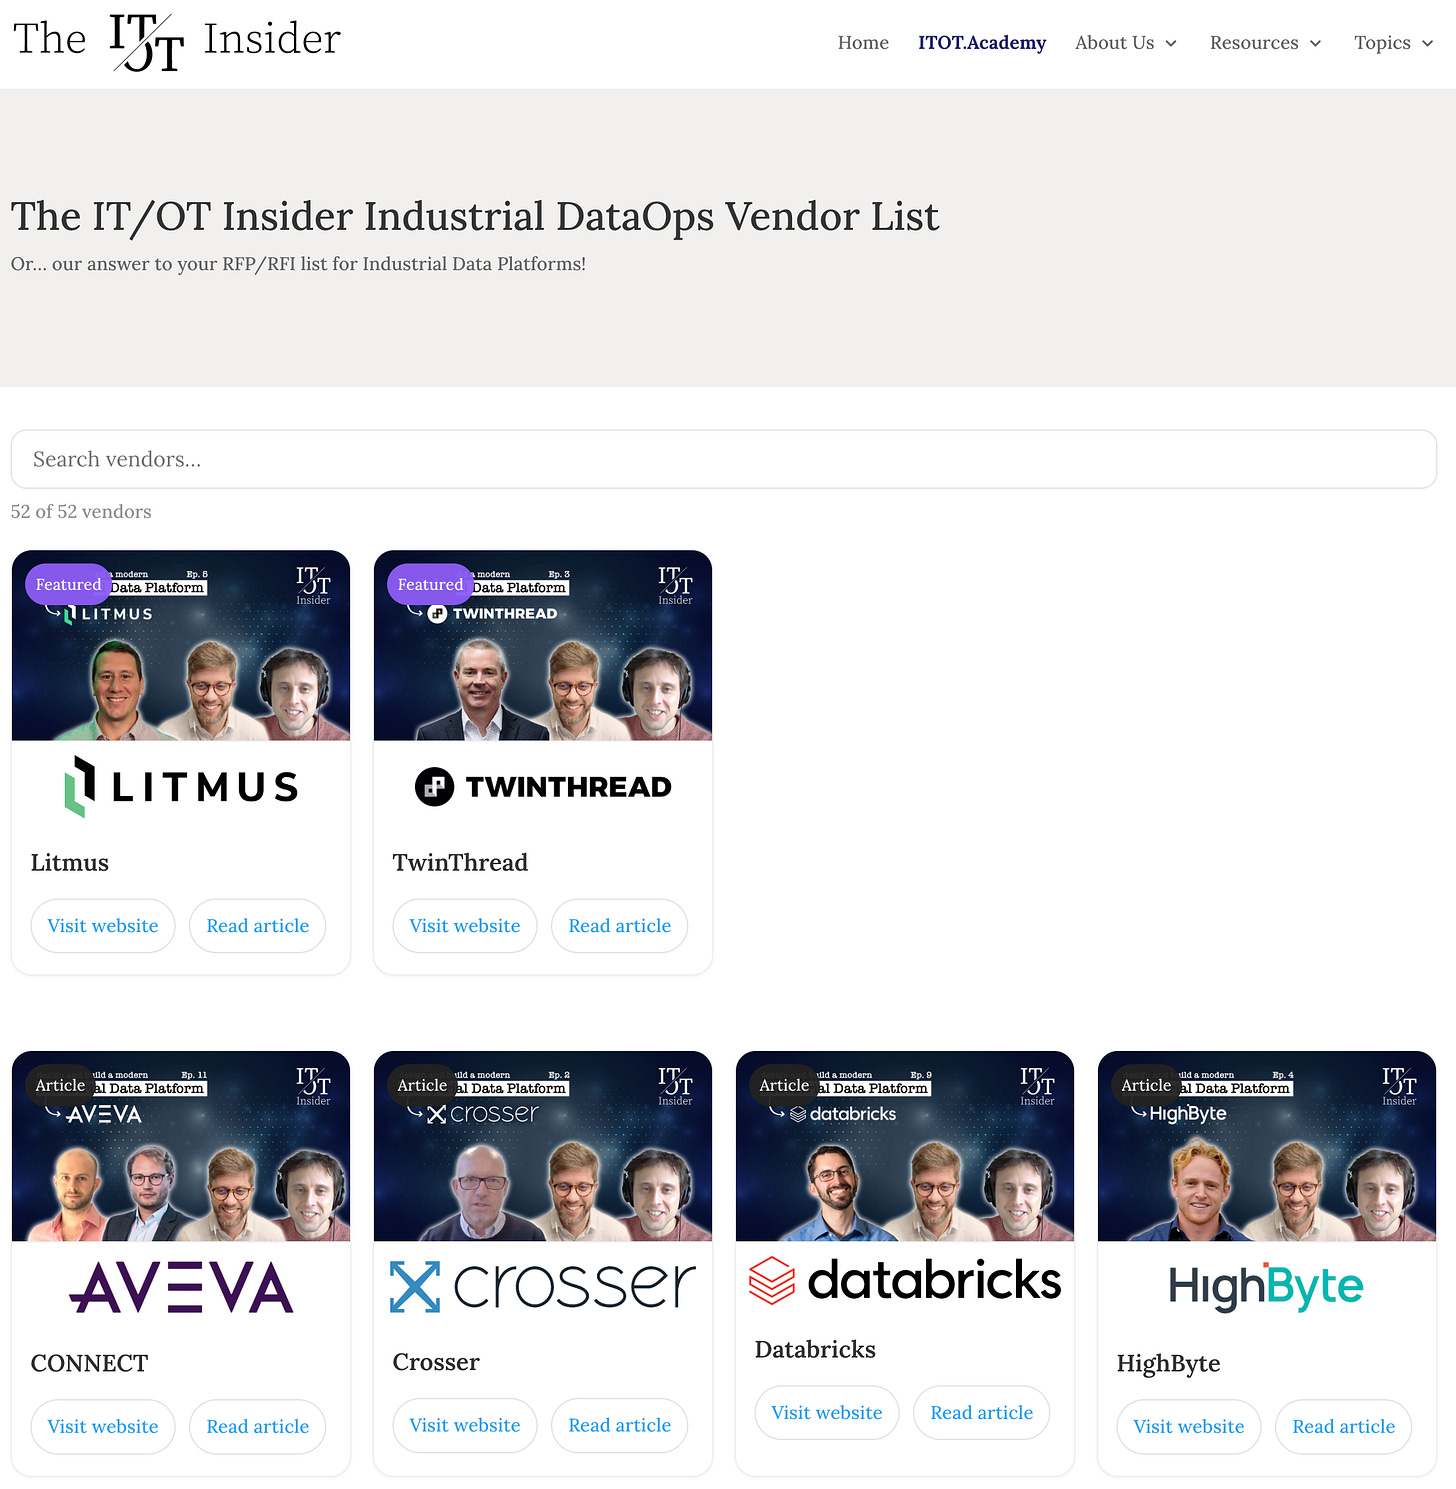
We launched our brand new Industrial DataOps Vendor list on our website to help you with your RFI/RFP Process! We even added direct links to all interviews we did earlier this year 🙂
You can find the list here: https://itotinsider.com/industrial-dataops-vendors-list/
Stay tuned!
“So, guys… what’s next?”, you might think.
Well, great question!
Here are some of our thoughts:
We still have a couple of followup articles planned, e.g. around single vs multi vendor approaches, ROI and even some podcasts featuring end users who actually went through these steps.
We will start a new series of articles, focussed on the data consumer part (the green cloud) and focus on Industrial AI. This series with articles, podcasts and more will run for the rest of the year.
Comments? Questions? Interested in a private training or in our partnerships?
You can find our contact details here.


IT/OT Insiders, you nailed the requirements and scope. Very grateful for your updated vendor list and am excited how we can all work together to provide better solutions for manufacturing. Well done guys. Hope we have a chance to talk data modeling, knowledge graphs, and MCP in the near future.
I haven't fully internalized the map, but on first pass the coverage of the platform looks a lot like Rhize to me. I know the IT/OT Insider doesn't promote specific products per se, so forgive me, but that is what came to mind. I keep coming back to that platform. Does your team know of other market offerings that fit the platform as the map describes? I understand if you aren't comfortable mentioning specific market offerings.